How to use BigQuery execution plans to optimize query performance
BigQuery breaks down your SQL into a series of execution steps (stages) and creates a query execution tree. The query execution tree consists of a series of leaf nodes and the master node. The execution plan is an ideal tool to understand how the query is turned into series of work units and it provides valuable insights on where the query is spending so much time.
Finding the execution plan for your query
To find the execution plan,
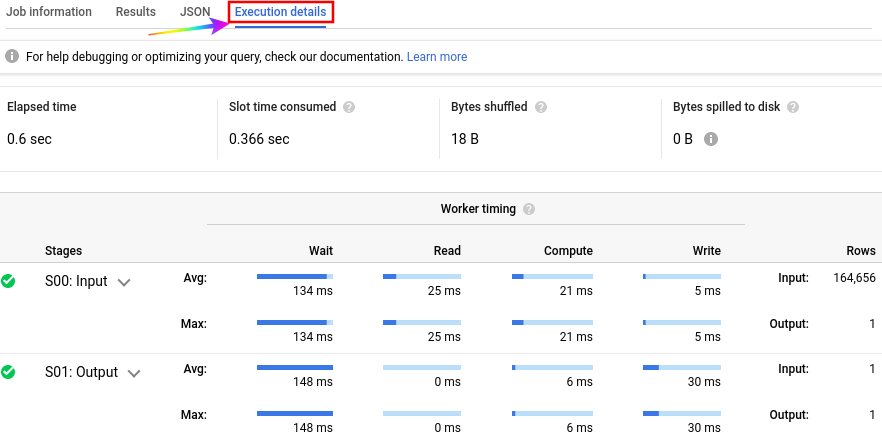
- Once you execute the query in the WebUI, Navigate to the the preview panel (The area right below the query editor), And click on the fourth tab "Execution details" to see the query plan
- To check the execution plan for older queries, you can navigate and find the query that you ran in the past using the "Query History" window and once you find the query, click on query to expand, and then click on "Open query in editor", Now you should see the "Execution details" in the preview panel (fourth tab)
Reading execution plan
In BigQuery, the execution steps are divided into stages with leaf nodes (stage 0) and mixer nodes (stages 1 to n). Each stage has 4 components,
- Compute phase - The actual processing takes place in Compute phase, such as evaluating SQL functions or expressions
- Wait - As the name implies, optimizer engine is waiting in the wait phase. It is waiting for either the slots to become available or for a previous stage to start writing results that it can begin consuming.
- Read phase - the slot is reading data either from Colossus (in the case of leaf nodes) or from a previous stage (in the case of mixer nodes).
- Write phase - The final data is written, either to the next stage, or the master node, which is the output returned to the developer
A well-tuned query typically spends most of its time in the compute phase, and an average compute time close to max compute time indicates an even distribution of data coming out of the previous stage
Post Comment