Snowflake virtual warehouse utilization optimization using WAREHOUSE_LOAD_HISTORY
It all comes down to one factor - The Cost $$$ ?. The Performance, Scalability and other benefits of the cloud are desired, but at the end of the day, all that matters is cost/value achieved. So, understanding exactly how the service is being used is very important. We can measure the compute credit usage, storage growth, and query performance to profile the warehouse and make crucial cost decisions.
You can use the WAREHOUSE_LOAD_HISTORY function to profile the warehouse load. This table function can be used to query the activity history (defined as the “query load”) for a single warehouse within a specified date range.
The syntax for calling these functions is simple and can be executed in the Worksheet in the Snowflake web interface. For example:
use warehouse mywarehouse;
select * from table(information_schema.warehouse_load_history(date_range_start=>dateadd('hour',-1,current_timestamp())));
The above query shows warehouse Load for the past hour for all your warehouses.
NOTE: The WAREHOUSE_LOAD_HISTORY function returns results in different intervals based on the timeframe you specify:
- 5-second intervals when the timeframe is less than 7 hours.
- 5-minute intervals when the timeframe is greater than 7 hours.
Here's a sample result for the query:
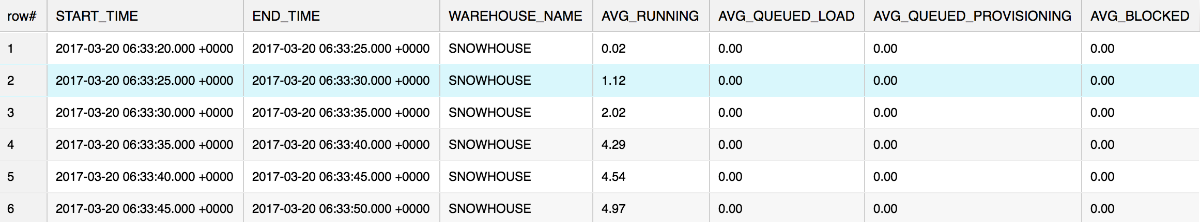
where,
- AVG_RUNNING – Average number of queries executed.
- AVG_QUEUE_LOAD – Average number of queries queued because the warehouse was overloaded.
- AVG_QUEUE_PROVISION – Average number of queries queued because the warehouse was being provisioned.
- AVG_BLOCKED – Average number of queries blocked by a transaction lock.
Finding an Underutilized Warehouse
Now that we know the amount of work that was performed during the time period (via WAREHOUSE_LOAD_HISTORY), We can find out the cost per time period (via WAREHOUSE_METERING_HISTORY), we can perform a simple efficiency ratio calculation for a particular warehouse using the below query:
with cte as (
  select date_trunc('hour', start_time) as start_time, end_time, warehouse_name, credits_used
  from table(information_schema.warehouse_metering_history(dateadd('days',-1,current_date()),current_date()))
  where warehouse_name = 'MarketingWH')
select date_trunc('hour', a.start_time) as start_time, avg(AVG_RUNNING), avg(credits_used), avg(AVG_RUNNING) / avg(credits_used) * 100
from table(information_schema.warehouse_load_history(dateadd('days',-1,current_date()),current_date())) a
join cte b on a.start_time = date_trunc('hour', a.start_time)
where a.warehouse_name = 'MarketingWH'
group by 1
order by 1;
In the above query, we are treating the average of AVG_RUNNING as work and the average of CREDITS_USED as cost and we apply a simple efficiency ratio on both of these values.
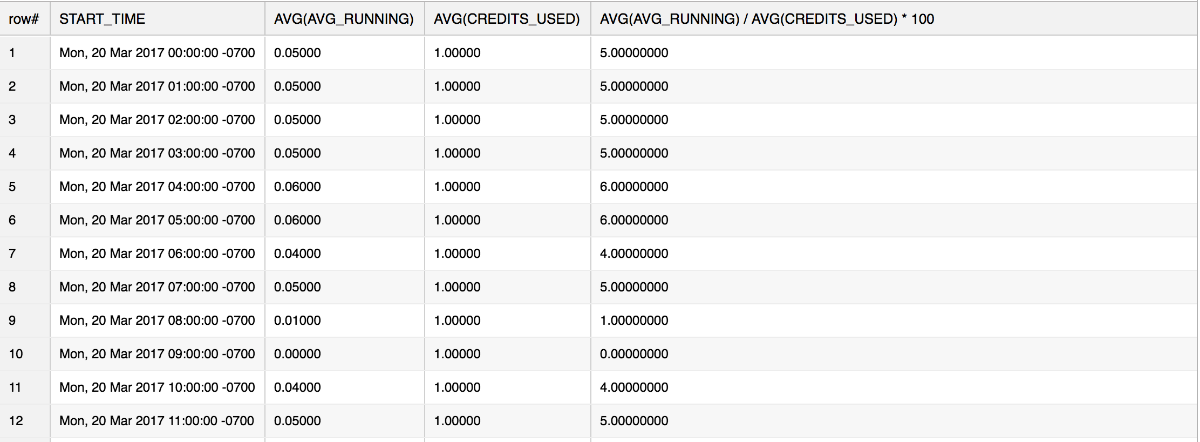
Any time slot with the lowest value in column 4 in the above result means it is poorly utilized.
We can do this profiling exercise across warehouses and determine,
- If you see a warehouse with a very low number of queries running, you may want to turn that warehouse off and redirect the queries to another less used warehouse.
- If a warehouse is running queries and queuing, perhaps it’s time to review your workflow to increase your warehouse sizes.
- If you have built your own client application to interface with Snowflake, reviewing your client scripts/application code should also reveal any biases towards one warehouse over another.
Hope this article helps you with saving some dollars ? and also help the environment ? by using resources responsibly

victor
posted onEnjoy great content like this and a lot more !
Signup for a free account to write a post / comment / upvote posts. Its simple and takes less than 5 seconds
Post Comment